There’s now an AI model between you and your customer

Your brand’s most important target isn’t a person anymore.
In our June 2026 study of 501 US adults, 43% said they’ve used AI to shop or research products, and about 1 in 5 do it regularly. Most people never set out to shop with AI; it is integrated into the places they were shopping anyway. This means many shoppers don’t know their questions or requests for recommendations are being addressed by AI. Their view of your brand or products is informed by what AI models have built from everything they can find about you online.
The Early Adopters of AI shopping tools provide a clearer perspective. Millennials, parents with kids at home, and affluent households index higher on AI usage for shopping. Narrow it from any AI shopping use to regular usage and the concentration sharpens: 30% of households earning $100K+ shop with AI regularly, nearly triple the 11% rate in households under $50K. The buyers with the most disposable income and the highest purchase frequency are using AI to inform their shopping, which is a good reason to take this data seriously.
So, what is AI actually doing when asked about your brand or product? The AI system takes in some product information, goes out and reads everything, and reports back a consensus. Ask which running shoes to buy and it pulls from reviews, forum threads, retailer listings, editorial roundups, and spec sheets. It weighs all of that against what it already “knows” about your brand and the category and compresses it into a summary with a recommendation. Your product page, however well written, is one input among many. A few great reviews won’t outweigh mixed sentiment across the rest of the web, because averaging past outliers is precisely what these models are built to do. That’s why GEO (Generative Engine Optimization, a fork of SEO) matters now.
To get the full picture, read the complete article here.
Next month’s Substack will follow this up with part two, which looks at where this is heading, who’s next, and why understanding it all requires researching the journey at three levels: quantitatively, qualitatively, and mechanically.

The Truth is Out There

Excited to share that TIME magazine featured our findings in their August story on the shift in American’s sentiment towards UAPs (formerly known as UFOs).
Earlier this summer, we conducted research for the Disclosure Foundation, a nonprofit led by former defense and intelligence officials that pushes for government transparency around UAPs. This has turned into a real policy conversation in a short span of time. The TIME article focuses on that shift, with the insights gained from our research as a primary proof point.
Our research findings made the case that public appetite for UAP disclosure isn’t fringe. 84% of respondents want more information from the government on UAPs. 69% believe UAPs are real. 59% support hearings and transparency laws. And just 21% trust the federal government to be telling the complete truth.
Additionally, across multiple metrics, we saw that UAP disclosure is a bipartisan issue. Democrats and Republicans report nearly identical levels of support for increased government disclosure on UAPs, the importance of scientifically vetted UAP information, and public hearings and bipartisan lawmaking for UAP transparency.
The rest of TIME’s story is largely about what evidence has been collected and what the files report. While the origins of UAPs are still contested, our data shows that the desire for transparent UAP information is not.
You can read the full research on the Disclosure Foundation’s site here and TIME’s piece here.

Financial Health: A Question Worth Adding to Every Survey
Household budgets are tightening in America. According to our F’inn Pulse survey fielded in July 2026, just 53% of Americans could cover a $1,000 expense without taking on debt. 69% of Americans are feeling the pressure of rising grocery prices, and 67% for gas prices, while 39% report rising health insurance costs.
Higher prices and tighter budgets mean tougher choices for shoppers. Understanding how that pressure affects your brand matters. Most surveys include household income and employment, but neither fully explains how households are managing the cost of living. So, we built a different measure: the F’inn Financial Health Measure. Based on self-reported financial health, respondents fall into one of three financial groups:
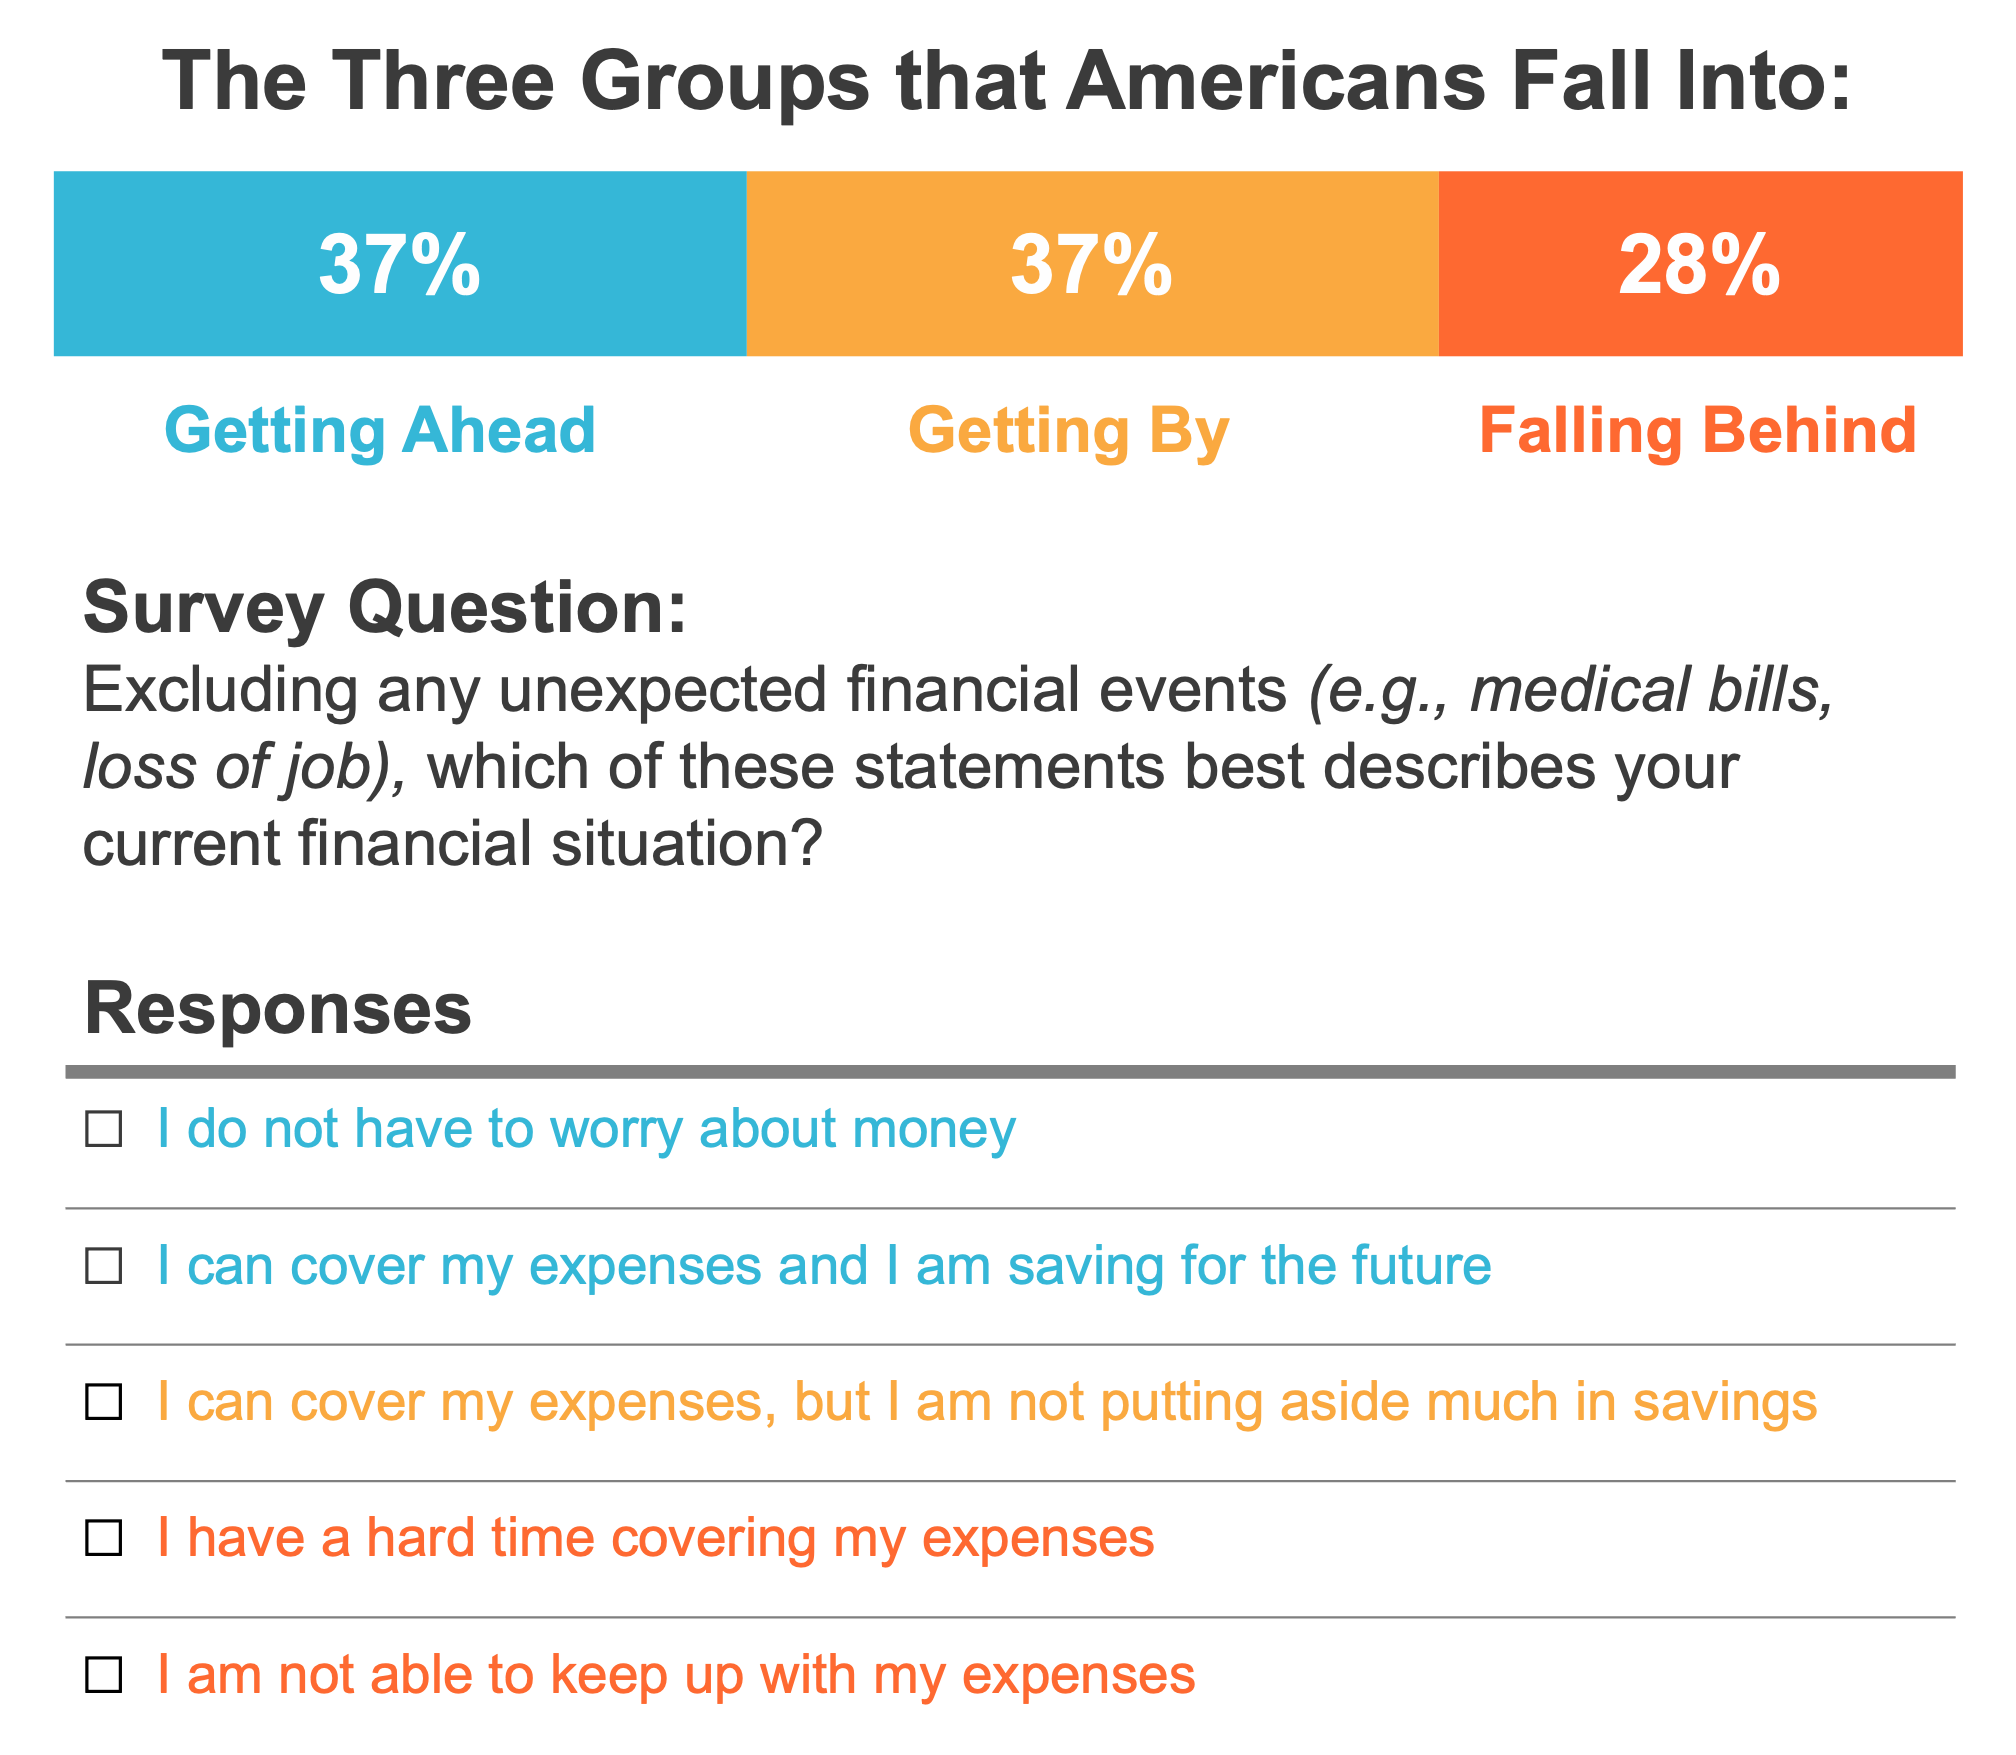
We’re now including this question in nearly every study we run, from segmentation to concept and messaging work, and it consistently improves our understanding. Consider these observations:
Where they shop: Walmart reaches all three groups (79% to 81% shop there), but Falling Behind are far less likely to shop at Amazon and Target.
AI use: Those Getting Ahead are far less worried about the risks of using AI - and as pointed out in our GEO piece, are using AI for shopping to a much greater extent.
Gender: Those Getting Ahead are predominantly male (65%); those Falling Behind are predominantly female (65%).
Mental health: Poor financial health is one of the strongest predictors of poor mental health. Roughly 4 in 10 (39%) of those Falling Behind report poor or fair mental health versus just 14% of those Getting Ahead.
Sustainability: Eco-Champions, the segment who prioritizes sustainability when they shop, are more likely to be Getting Ahead. Alarmed Masses, our largest sustainability segment, care just as much but need sustainable options made affordable and easy, not aspirational.
Consider adding the F’inn Financial Health Measure to your research to better understand how financial pressure is affecting your brand(s). We’ve gathered extensive information on these groups, including demographics, mental health, politics and voting, sustainability attitudes, AI adoption attitudes, and more. Reach out to learn more.